Commission Calculus: Calculating True Costs in Betting Exchange Broker Selections
Written by Rafael Werner · Apr 8, 2026
Commission Calculus: Calculating True Costs in Betting Exchange Broker Selections
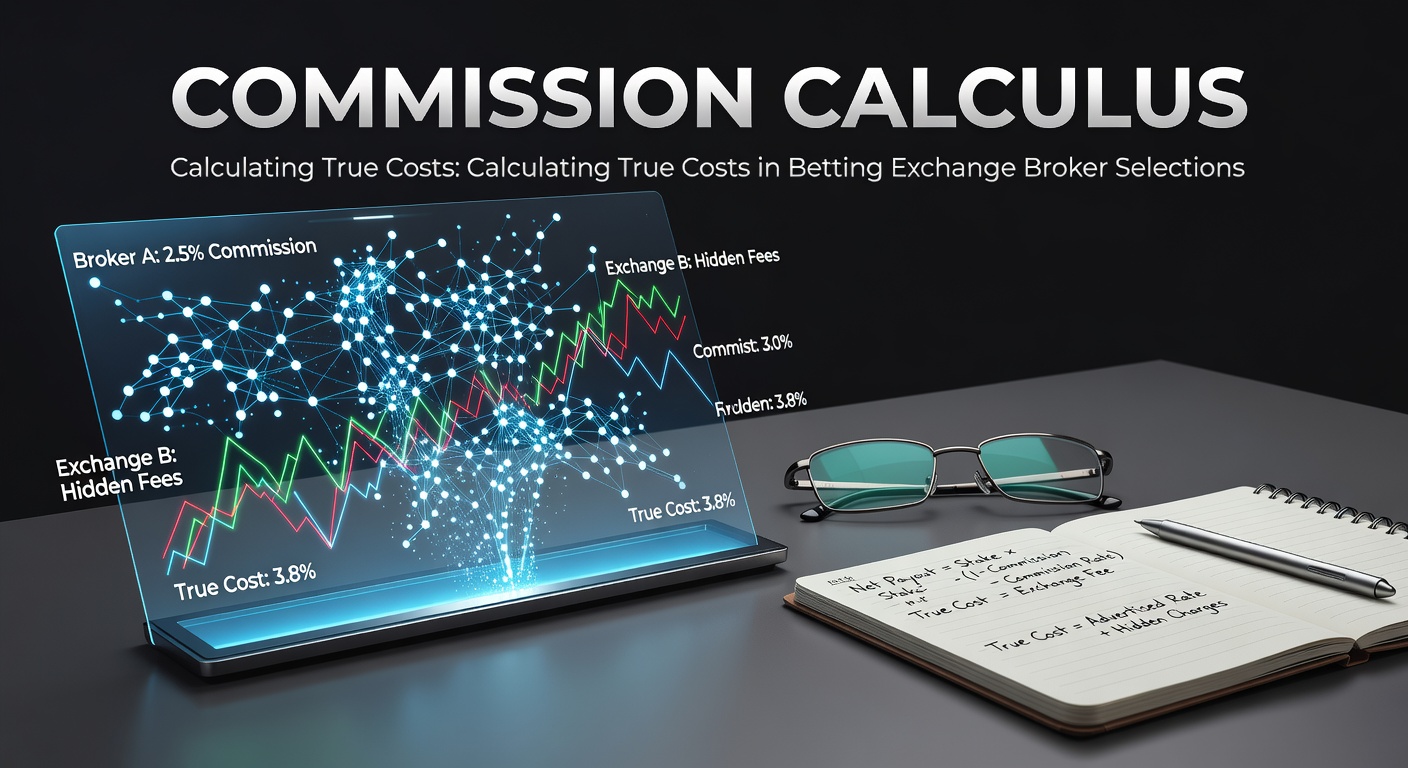
Traders diving into betting exchanges quickly learn that commissions represent the silent gatekeeper to profits; these fees, often a percentage skimmed from winning bets, can erode edges faster than unexpected market swings, especially when brokers layer on extras like withdrawal charges or premium service costs. Data from industry trackers reveals average commission rates hovering between 2% and 6% across major platforms, but the true tally emerges only after factoring in volume discounts, loyalty tiers, and those sneaky ancillary fees that pile up over high-stakes seasons.
Unpacking Commission Structures in Exchange Brokers
Exchange brokers operate differently from traditional sportsbooks since they facilitate peer-to-peer matching rather than setting fixed odds themselves; commissions kick in primarily on net winnings, meaning backers and layers pay only when they come out ahead, which keeps costs aligned with success but demands precise tracking. Observers note that while base rates might look identical at first glance—say 5% across the board—variations appear through market-specific adjustments, where football trades might carry lower fees than niche events like darts, and premium markets for horses often command steeper cuts because liquidity draws bigger fish.
But here's the thing: many brokers offer tiered systems where high-volume traders drop to 2% or less after hitting monthly turnover thresholds; one analysis by the International Betting Integrity Association shows traders averaging £50,000 in matched bets per month qualify for these reductions, turning a potential 5% drag into something far more manageable. And then there are the outliers—brokers charging flat fees per trade or inflating costs via slower payment processing that ties up capital longer, indirectly hiking opportunity expenses.
Breaking Down the Fee Layers Beyond Basic Commissions
True costs extend well past headline percentages because withdrawal fees, inactivity charges, and even currency conversion spreads add up stealthily; for instance, brokers handling international clients often tack on 1-2% for forex shifts, while those demanding minimum deposits impose upfront hurdles that lock funds unnecessarily. Figures from a Nevada Gaming Control Board review of offshore platforms highlight how these extras can boost effective rates by 1.5% on average for cross-border traders, a detail that surfaces only in fine print.
What's interesting is how payment methods influence the equation—e-wallets like Skrill or Neteller might dodge fees entirely on some brokers, yet others slap 1% outgoing charges, and that's before considering deposit bonuses with wagering strings attached that inflate rolled-over amounts subject to commission. Traders who've crunched the numbers often discover that opting for crypto gateways, available on select platforms, slashes these peripherals since blockchain transfers bypass traditional banking markups, although volatility introduces its own calculus.
Now consider service tiers: basic accounts pay standard rates, but VIP upgrades—unlocked via consistent activity—slash commissions while bundling faster support and exclusive tools; data indicates these perks repay themselves within 3-6 months for active users, yet casual punters rarely qualify, leaving them exposed to full freight.
The Math Behind True Cost Calculations
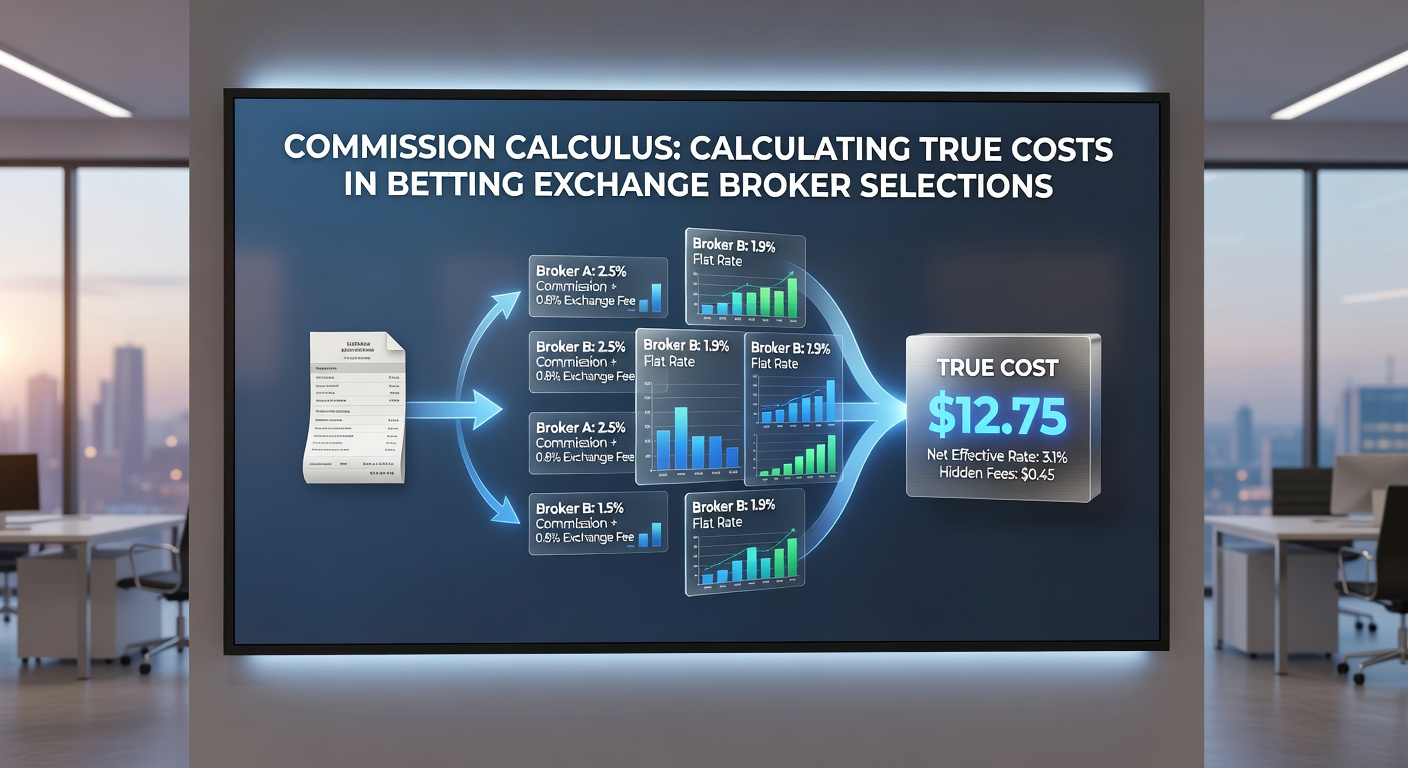
Calculating net impact starts with a straightforward formula: Net Profit = (Gross Winnings - Stakes Returned) × (1 - Commission Rate) minus any fixed fees; apply this across a portfolio, and patterns emerge, like how a 4% rate on £10,000 monthly winnings devours £400, whereas dropping to 3% via volume preserves an extra £100 that compounds over seasons. Experts recommend spreadsheets tracking matched volume, win rates, and average odds since lower liquidity markets amplify commission pain due to wider spreads eating into edges before fees even apply.
Take one case where a trader lays horses at 2.0 odds across 100 bets totaling £20,000 matched; at 5% commission on £2,000 net wins, costs hit £100, but switching brokers with a 20% volume discount trims that to £80 while faster payouts free capital for immediate redeployment—small shifts that scale massively in tournaments like the World Cup. And for layered strategies involving greening up positions mid-event, repeated commission hits on partial settlements demand even finer tuning, as each adjustment triggers fresh deductions.
Longer-term models incorporate expected value (EV): EV post-commission = (Probability of Win × Profit Potential) - (Probability of Loss × Stake Risk) - Commission Drag; studies from Australian researchers reveal that overlooking this leads to 15-20% underestimation of costs for scalpers who trade frequently on thin markets.
Broker Comparisons Through a Cost Lens
Side-by-side evaluations expose disparities vividly—Broker A might tout 4.5% headline rates with no withdrawal fees, yet Broker B counters at 5% but waives charges above £500 and offers 30% rebates on football volumes; real-world data shows B edging ahead for Europeans due to seamless integrations, although North American users favor A for USD-native handling that skips conversions. Observers point out how seasonal promos tilt the scales temporarily, like reduced rates during NFL playoffs, but sustainability hinges on baseline structures.
Yet liquidity matters hugely since thinly traded books force worse fills, mimicking higher commissions; platforms linked to major exchanges like Betfair dominate here, boasting depths that minimize slippage, and that's where the rubber meets the road for pros chasing arbitrage plays across correlated events.
Regulatory shifts add another layer, particularly as April 2026 brings remote gaming duty hikes to 40% in some jurisdictions, prompting brokers to rejig fees or pass costs via tighter spreads; traders monitoring these changes via industry feeds stay ahead, recalibrating selections before the pinch fully hits.
Offsetting Costs: Bonuses, Rebates, and Loyalty Plays
Bonuses serve as counterweights, with sign-up offers matching 100% of first deposits but often capped at £200 and tied to 5x rollover—meaning £1,000 deposited demands £5,000 matched before withdrawal, during which commissions apply fully; smart calculators weigh this against saved fees, revealing break-evens around 3 months for moderate volumes. Ongoing rebates, however, shine brighter: 20-50% cashback on commissions paid monthly pads bottom lines steadily, and data shows top earners reclaim up to 1.5% effectively through these.
People who've mastered this blend report nets improving 10-15% post-optimization; one trader documented switching mid-year to a rebate-heavy broker, boosting yearly take-home by 12% despite marginally higher base rates, since the math favored volume over purity.
But pitfalls lurk—bonuses with short expiry or high minimums trap funds, and while crypto bonuses allure with zero-fee deposits, tax reporting complexities in regions like Canada complicate the upside; those navigating this use compliance tools to ensure offsets genuinely lower true costs.
Tools and Strategies for Ongoing Calculus
Excel templates and dedicated apps simplify the grind, inputting rates, volumes, and frequencies to spit out projections; free calculators from broker sites provide baselines, but third-party ones aggregate multiples for apples-to-apples views, factoring live promotions too. Advanced users script APIs pulling real-time data, automating alerts when a broker's effective rate dips below thresholds.
Seasonal recalibration proves key—pre-major events like Euro 2024 finals, brokers slash rates to lure volume, creating windows where costs plummet temporarily; tracking these via newsletters keeps selections sharp.
- Track monthly matched bets against tiers for discounts.
- Simulate 100-trade scenarios blending wins, losses, commissions.
- Factor payment speeds since delayed funds cost daily interest equivalents.
- Review quarterly, especially with 2026 tax surges looming.
Conclusion
Mastering commission calculus transforms broker selection from guesswork to precision, as traders who diligently tally base rates, fees, rebates, and intangibles like liquidity uncover hidden edges that sustain profitability amid tightening markets. Data underscores that those prioritizing comprehensive models over headline figures net 8-12% higher yields annually, a margin that widens with scale; with regulatory pressures mounting into 2026, staying vigilant on evolving structures ensures costs remain in check, letting skill dictate outcomes rather than overlooked deductions.